

In early 2021 we published the first version of the OpenOcean Interactive Market Map for Automation. We knew the content was of value, but we didn’t quite anticipate the landslide of interest our pet project received. A lot has changed in the world of automation since January 2021, and we thought now might be a good time to refresh and update this resource.
Driven by the Covid-19 pandemic, enterprise investment into automation solutions has seen a significant uptick - according to Deloitte there has been a 52% increase during the pandemic in the number of organizations worldwide using automation technologies. From the perspective of startups in this space, this translates to bigger rounds and higher valuations. According to Pitchbook data, the wider software automation space has raised at least $18B funding from private investors in 2021, a 2.3 x increase from 2020. The largest single round was raised by the process mining vendor Celonis, which raised $1 billion at an $11 billion valuation. The largest IPO was by no question UiPath’s - reaching a $38 billion valuation at the end of its first trading day.
One of the main drivers for making this map is that many still only think about RPA when talking about automation. In reality, of all VC and PE investments into software automation in the last 10 years, only 7% has gone into RPA. There is definitely a time and place for RPA, but it is not always the best solution for a specific need. A customized solution, for instance, in Sales & Marketing, is often more powerful than an in-house built solution using RPA workflows.
Even when building in-house automation workflows - by using large RPA vendors like UiPath, Automation Anywhere or BluePrism - we argue that none of these so-called end-to-end platform vendors have the best building blocks for everything. Enterprises looking for automation solutions should not purely think of which RPA vendor to choose, but rather start by identifying their key automation needs and opportunities and choosing the best available tools for their needs.
The OpenOcean market map today includes 739 software automation companies (compared to 120 in 2021), to better represent the wider software automation space as a whole. Focus has been on companies with an estimated valuation of >$100 million, as well as only the most exciting earlier-stage startups.
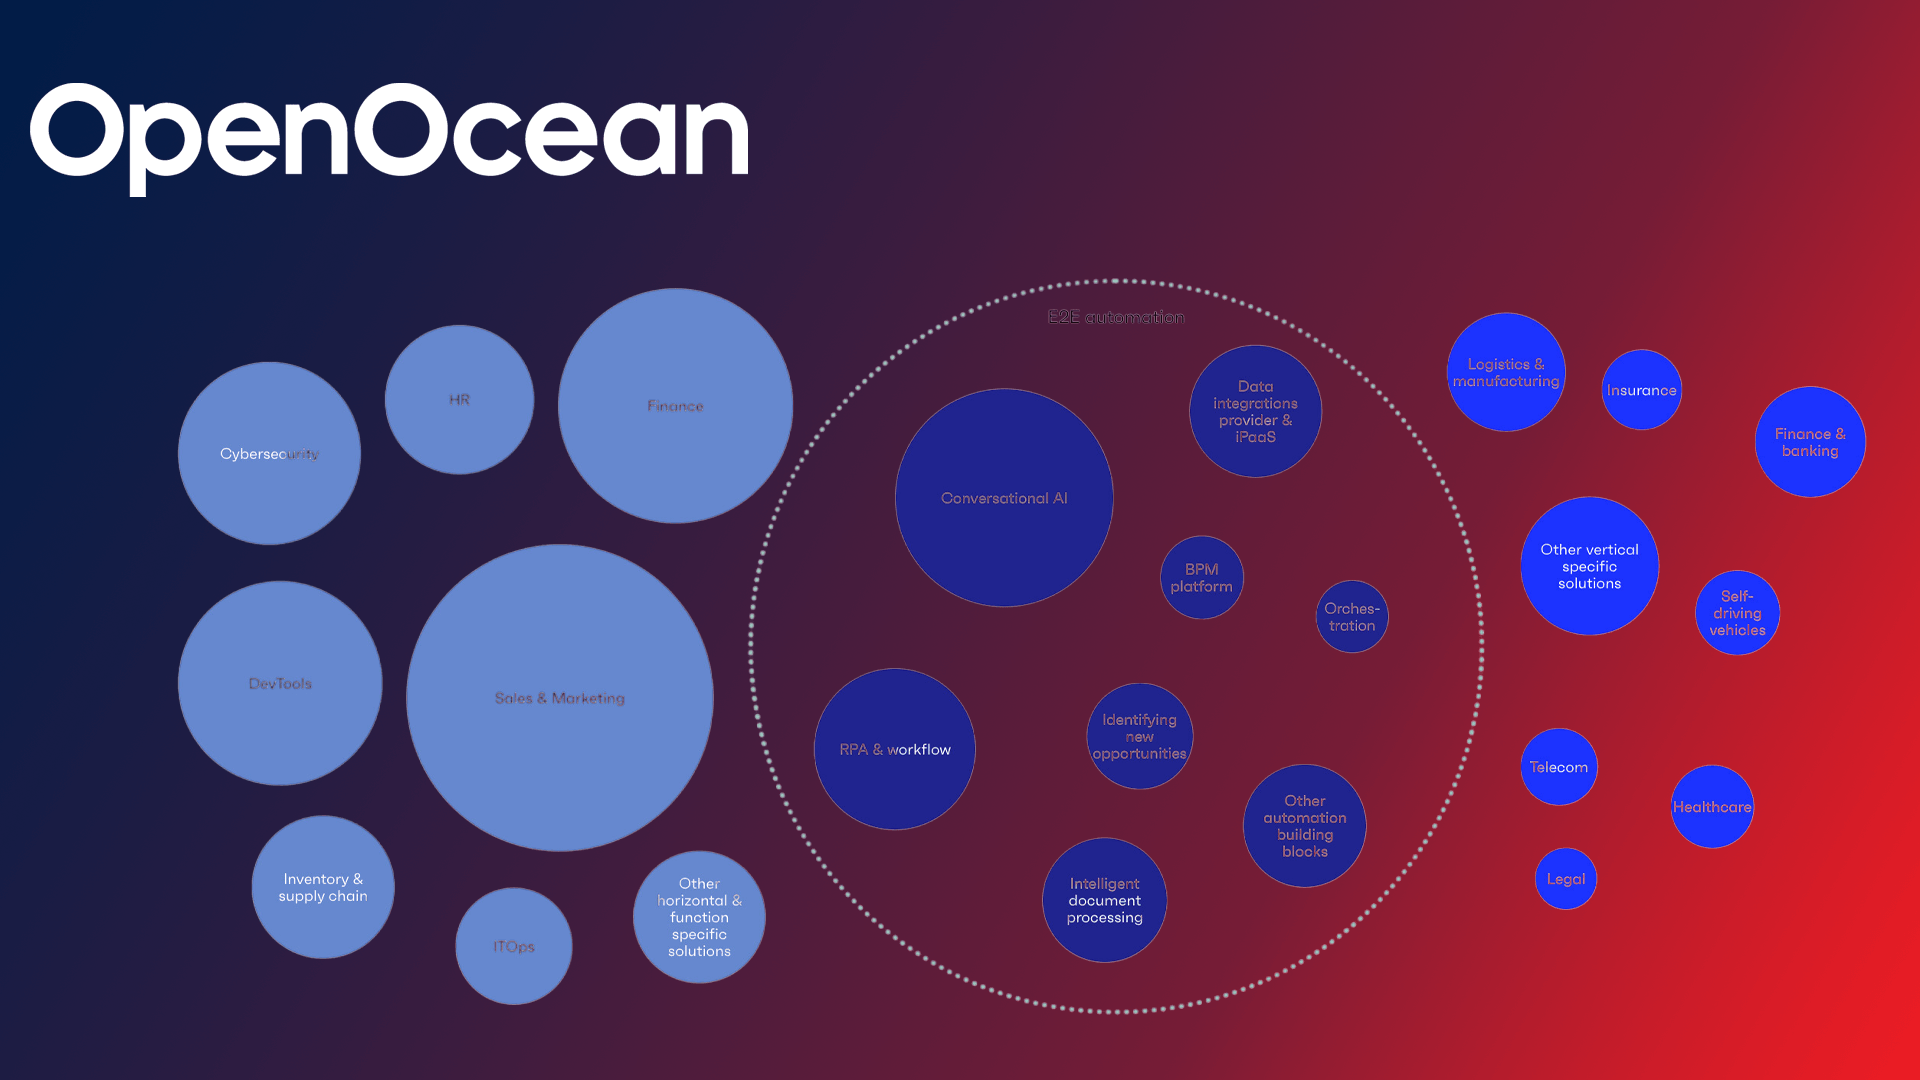
In the map, the size of the area visualizes the absolute number of companies in each subcategory. As we can see, automation building blocks and E2E automation players represent only ~25% of companies, whereas horizontal & function-focused players represent ~60% of all solutions.
Please visit OpenOcean’s website to learn more about the individual categories and companies within these. We’ve worked hard to define a map with precise coordinates, but you might disagree with a logo’s location, or you might think that an important subcategory is missing. That’s why we’ve again made this map interactive: Submit your suggestions here, and we’ll consider adding them to the map!


Would you like to write the first comment?
Login to post comments